One of the questions that keep popping up around Kotlin is “How can I run a linter on my builds?”
It’s actually quite easy and there are various options. In a series of blog posts I’ll show you how to use the different tools available
and integrate them with your build server.
I’ll be using TeamCity and while some things are unique to this product, generally you can use any CI server you like. Having said that, the combination of TeamCity and IntelliJ IDEA (this works both for IntelliJ IDEA and Android Studio, I just always refer to it as the former) inspections does offer quite a bit in terms of
user experience as I’ll hopefully outline in this first post which covers exactly these two tools.
If you’re not familiar with TeamCity, know that it’s a scalable build tool that was born out of our own need at JetBrains, and there’s a free Professional version available.
What we’re going to see
We’ll cover
- IntelliJ IDEA Inspections
- Running inspections on TeamCity
- Examining inspections
- Failing our build based on inspections
- Defining what inspections to run and when
- Running server-side inspections
- Running inspections without TeamCity
IntelliJ IDEA Inspections
IntelliJ IDEA comes with a series of inspections that are responsible for highlighting issues in your code, and often times give way to Intentions (i.e. Alt+Enter and try and resolve the issue). Examples include unused variables, invalid property keys, etc.
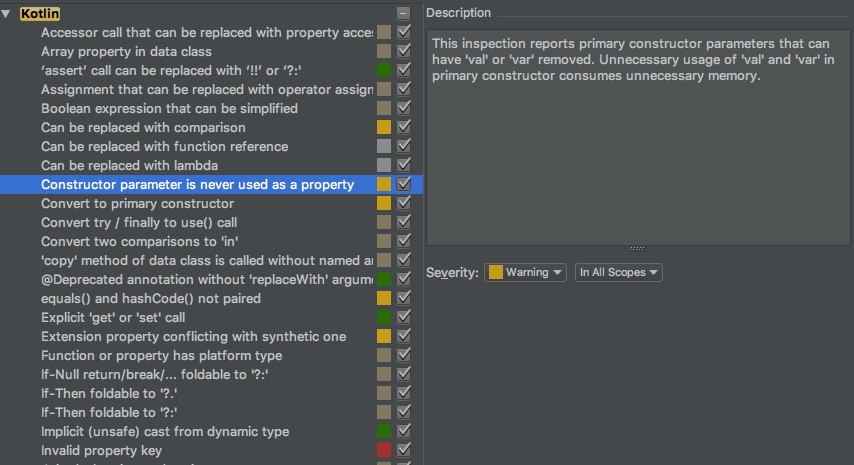
These same inspections can be run on the server as part of the build process and can be used to fail a build in case a certain threshold is reached. Currently IntelliJ IDEA inspections don’t touch much on formatting concerns such as tabs versus spaces (is this still an issue?) or indentations. There are a couple of inspections in this area and hopefully more will come soon.
Running inspections on TeamCity
To run inspections on TeamCity, we simply add a Inspections (IntelliJ IDEA) build step to our build configuration
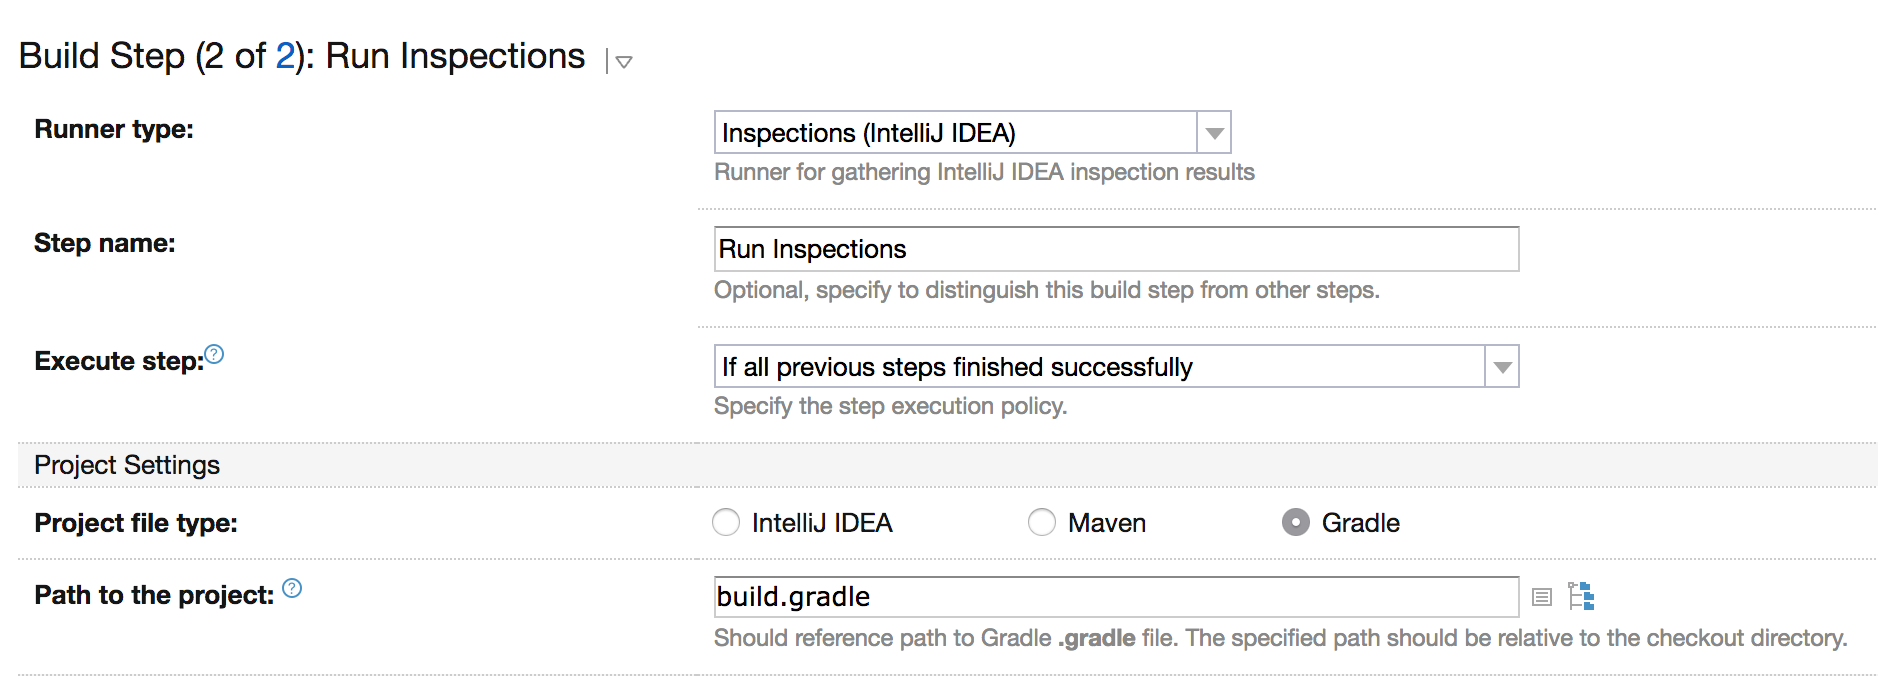
We need to provide the name of the build step and the type of project. In the case of it being Maven or Gradle, we also indicate the path to the build file. As soon as we enable this, we can get the same inspections we have in the IDE, running on the server.
Examining inspections
Once we have inspections configured and our build has run, we can click the new Code Inspections tab and see the different issues raised, drilling down into each category
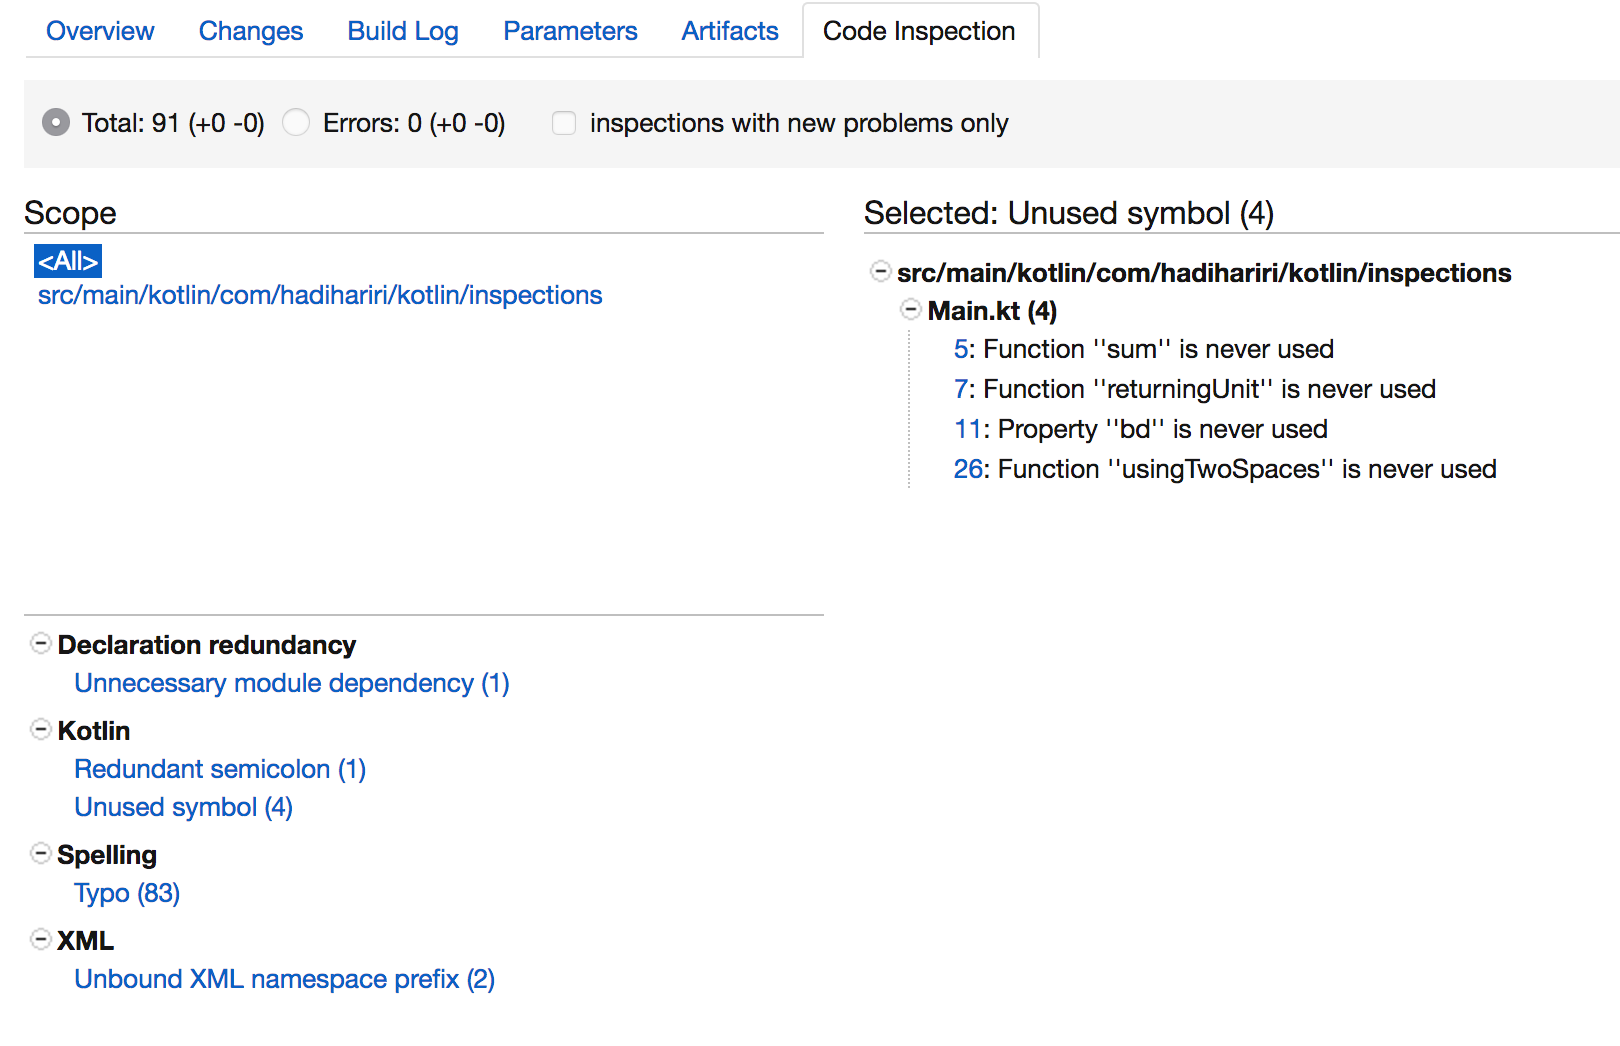
Seeing inspections in TeamCity is nice, but sometimes we want to see this in the context of the project in our IDE. And this is possible - next to each inspection there’s a line number which if we click on will open the inspection for us in the project in our IDE. However, we do need to have a TeamCity plugin installed in the IDE.
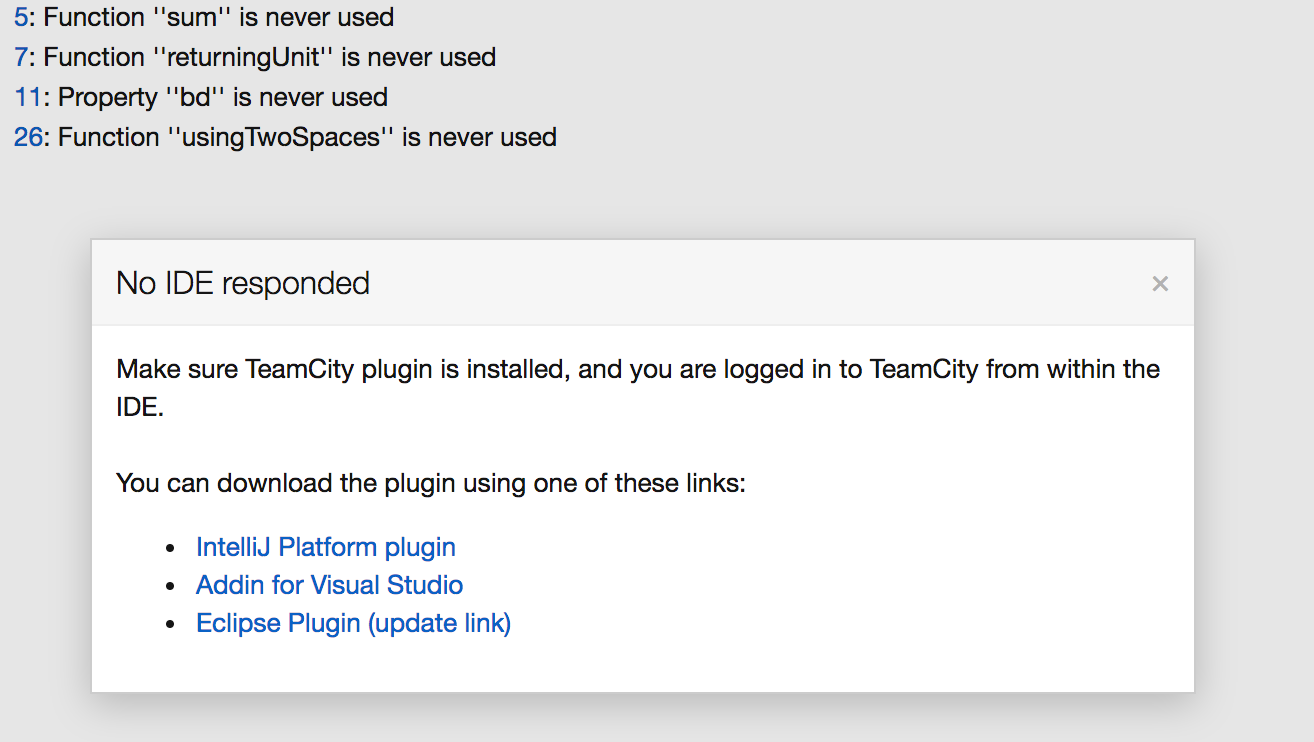
With the plugin installed, set up correctly (i.e. configure the login to the right TeamCity server) and the project open, clicking on the inspection in TeamCity will take us directly to the issue in our project
Failing Builds
We now have inspections running on the server, but what happens if we want to react to this, like for instance failing the build. TeamCity allows us to do just this. Under
Failure Conditions in the build configuration, we can add a new condition based on the results of the inspections
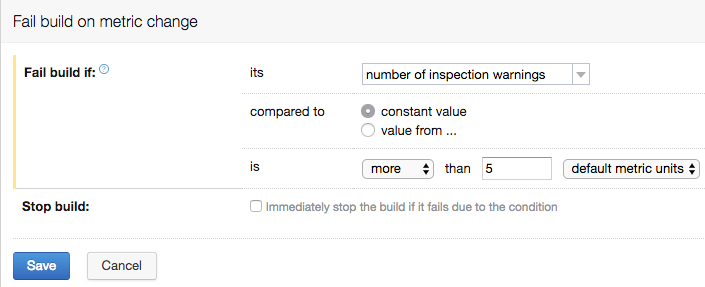
The condition can reference a constant value, for instance when we have more than 10 warnings, fail the build. But a more useful case is
to have a condition based on previous builds.
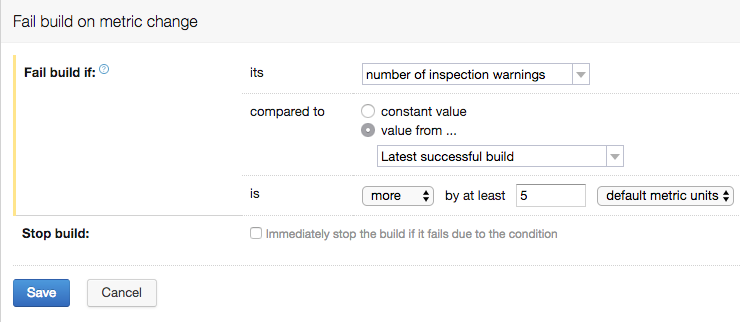
For example, imagine we start a new project that potentially has 100 inspections, it’s not viable to have this build fail due to this. What we want to do is incrementally improve it. For this
we can create a failure condition that compares each new build with results of the last successful build and if it surpasses a certain threshold, it fails.
Defining inspections
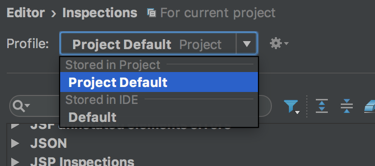
By default, TeamCity will run all the inspections that IntelliJ IDEA provides, but we can fine-tune this and specify exactly which ones we want run. This can be useful in scenarios where we want a different set of inspections to be run team-wide versus locally. The way to go about defining the inspections is to specify a profile name. In IntelliJ IDEA we can do this using the Profile option under Inspections
Once we have the profile we then need to instruct TeamCity to run this specific one. That’s done on the Inspections configuration page
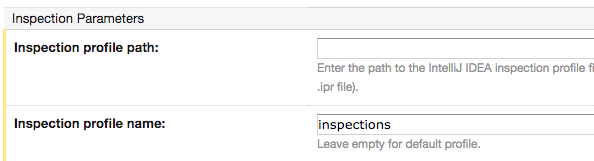
When we specify the profile name, it will then only run those specific inspections. By default, the inspection configuration is located under the .idea/inspectionProfiles
folder of the project. We can use this location, or optionally export the profiles via IntelliJ IDEA Profile export option to a different location
and indicate this in the configuration in TeamCity. If you want to keep profiles editable easily and in sync using the IDE, the former option is recommended.
Deciding when to run inspections
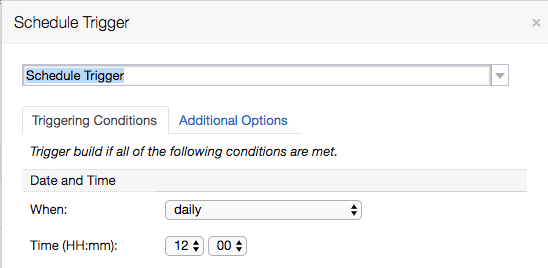
In addition to defining what inspections to run, it’s also sometimes useful to indicate when we want the inspections to be run. In our current configuration, we’re running them as a build step under a single Build Configuration. The first step builds the project and the second, runs the inspections. And this is triggered for every check-in. Sometimes we might not want this to happen - for instance certain inspections are time-consuming or do not need to be verified on each build. For that, the recommended approach is to create a second Build Configuration specifically for inspections and set the appropriate trigger under TeamCity. This could be for example a time trigger - run once every 24 hours.
These two options allow us to now have better control over what inspections are run and when.
Running server-side inspections
In light of some inspections taking potentially a long time to run or being different from those run locally, the IDE plugin for TeamCity allows us to actually get the results of a server-side inspection directly in the IDE. For this we can choose to run code inspections from the TeamCity menu
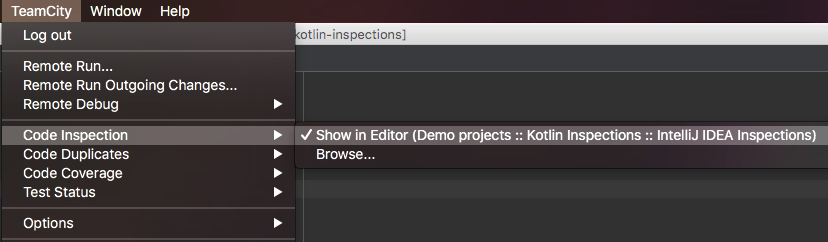
and choose the corresponding Build Configuration. TeamCity will then fetch the results and display to us the issues directly in the IDE.
Running inspections without TeamCity
As you’ve hopefully seen, TeamCity provides good integration with IntelliJ IDEA and a pleasant experience, allowing the two tools to exchange information and make this accessible in an easy way. If you’re not using TeamCity though, you can still run IntelliJ IDEA inspections using a command line tool. You would need to however configure your server to invoke this and then parse the results somehow. Note that if using IntelliJ IDEA Ultimate (i.e. not Community or Android Studio), you’d need the corresponding license.
In another post we’ll see how to use a different linting tool with TeamCity.