Last week we announced a new product by JetBrains for .NET developers: dotCover, a code coverage tool. We are aiming to open the EAP this week and some of our Academy Members have already been playing with it since last week. In this post I’m going to provide some more info on how it works.
Code Coverage 101
Code Coverage is a means by which you measure the percentage of your code that is covered by tests. Technically,the higher the percentage, the less chances of finding hidden bugs when it’s too late. You could therefore assume that 100% coverage is ideal, and you’d most likely be wrong. Having your entire code base covered by tests doesn’t necessarily mean that you are safe. Code Coverage analyzes what parts of your code are covered by tests. It doesn’t tell you whether the code you’ve written is correct. Additionally having a higher percentage often gives a false sense of security, that the code is now bug-free and doesn’t require any other type of testing.
Does this mean therefore, that Code Coverage is useless? Quite the contrary. Code Coverage tools normally provide, at a minimum, two pieces of relevant information: the percentage of code covered and the actual lines of code covered. However, what is important is not so much the code that is covered, but what is not covered. If I have a code base with 70% code coverage, what is more valuable to me than knowing that 30% of my code is not tested, is finding out what the code is. This allows for me to find potential issues that would otherwise go unnoticed.
Testing code for coverage with dotCover
Disclaimer: At the time of writing this blog post, dotCover is still pre EAP so not everything might work as expected
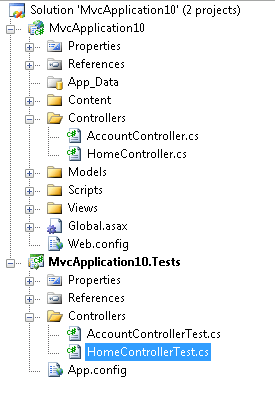
It should somehow be apparent that coverage tools need to work in conjunction with testing frameworks and unit tests. I’m going to base this post on the sample MVC application that ships with ASP.NET MVC 2, the one that comes with some default controllers, not the blank one, you know, the one that doesn’t even bother asking us whether we want a unit test project or not. The project ships with two controllers, HomeController and AccountController along with some corresponding tests.
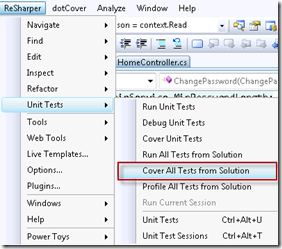
Similar to dotTrace, dotCover works nicely with ReSharper. When you install dotCover, you see several options appear in the ReSharper menu options as well as the Test Runner window. First of all, under ReSharper | Unit Tests menu option, there is a new option to run coverage reports, either for specific tests or for the entire solution.
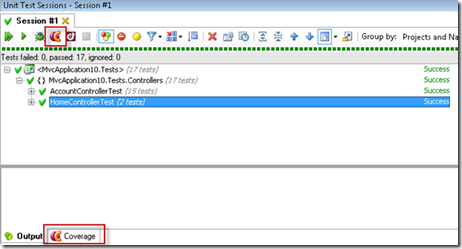
Similarly, the Test Runner Window offers us the same options. We get a new icon to run tests under coverage, as well as a new tab that will display the output of the coverage report.
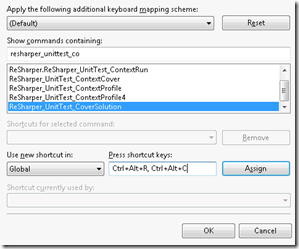
Based on the information we want to obtain, we can run coverage reports on the entire solution or only certain tests. Running on the entire solution will give us a measurement of how much our entire code base is covered. In order to do so, we can select Cover All Tests from Solution. You can assign whatever keyboard shortcut you want to this action by selecting the ReSharper_UnitTest_CoverSolution command, as shown below
Executing the command will run the unit tests and once completed will then proceed to run a coverage report.
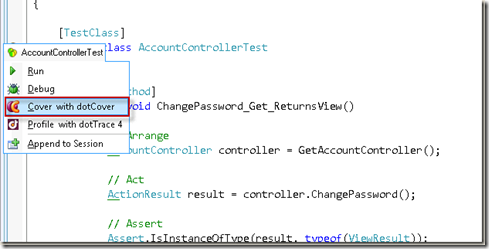
We can also run coverage on individual tests or classes, by selecting them and choosing to Cover with dotCover
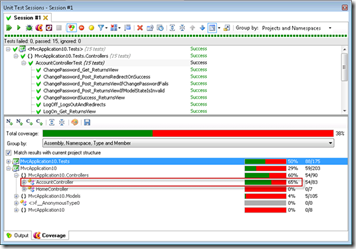
Let’s try this on the AccountController tests. When we run the coverage, the unit tests will execute inside the ReSharper test runner and once completed, it will then proceed to run coverage reports. To view the results, we can click on the dotCover tab
The window groups coverage reports based on the option selected in the dropdown list. We’re interested in the amount of coverage of our main assembly, not that of the tests (in the future we’ll able to filter test assemblies out). By expanding the node that references our assembly, we get more insight into the actual coverage. Notice that HomeController is at 0% coverage. This doesn’t mean that there are no tests, but that in this specific test run, none of the tests have been executed. This is because we chose to run only the AccountController tests.
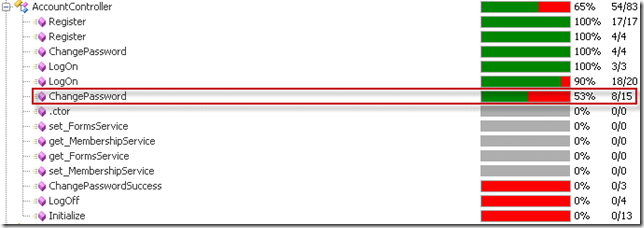
dotCover provides us with two measurements: percentage of code covered and number of statements. As such, if we have 83 statements in AccountController out of which 54 are covered with tests, that should indicate 65% coverage. Let’s dig a little deeper to see what is not covered.
We can see that out of the eight actions, four have complete coverage and two have partial coverage. One of these with partial coverage is ChangePassword. There are two overloaded actions for it and it’s a common pattern in ASP.NET MVC applications; one corresponding to a GET request and another to a POST. The second one in the coverage report corresponds to the latter, and shows only 53% coverage. To see in more detail why this is, we can select the Highlight Code icon on the test runner panel
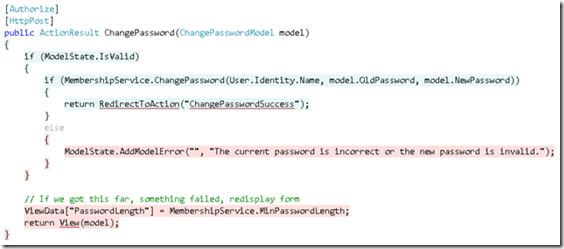
This will highlight the paths of the code that are covered/not covered by tests. Next step is to select the ChangePassword action by double-clicking on it
The lines colored in Cyan mean that they are covered by tests, whereas those in Lilac are not in the execution path of any of the executed tests. In the case of ChangePassword we can see that the test only covers the situation where the model state is valid. This allows us to easily identify non-happy paths of our application and make sure that when relevant, the correct tests are in place for it.
What’s coming…
dotCover is still in it’s infancy and we’ve got a lot planned in terms of features and functionality. Quite a few people have asked whether it will support running coverage reports from a console, which is important for continuous integration. dotCover will support running from a console with some basic functionality, and we have plans to include specific features for CI processes.
If you’re not already following the dotCover Twitter account, make sure you do as we’ll release information and updates as things move forward.
