As some of you know, we recently shipped TeamCity 6 which includes, out of the box, a bundled version of dotCover. What this means is that you can now get coverage reports for your code easily, and of course, for free if you’re using the Professional version of TeamCity. The setup is quite easy if you are using MSTest and NUnit. For MSpec, you need to take a few additional steps.
Using MSTest / NUnit Runners
Normally build files consist of a series of tasks that involve compilation and running of tests. With TeamCity, you can separate some of these steps out into individual TeamCity Build steps, which is what we will be doing in this case (everything that we see here applies to both MSTest and NUnit).
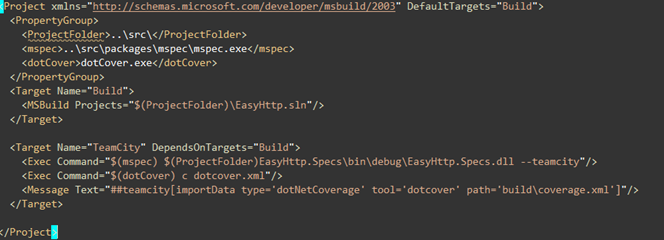
Here is our build.xml (MSBuild) file:
As we can see, other than compiling a solution, which in this case consists of the actual application and the test assemblies, not much else going on.
[Note: this could have been done using the SLN as the Runner Type under TeamCity since this example build script does not do much else. In real scenarios however, build scripts do more than just call a solution (in fact normally you’d call projects not solutions)].
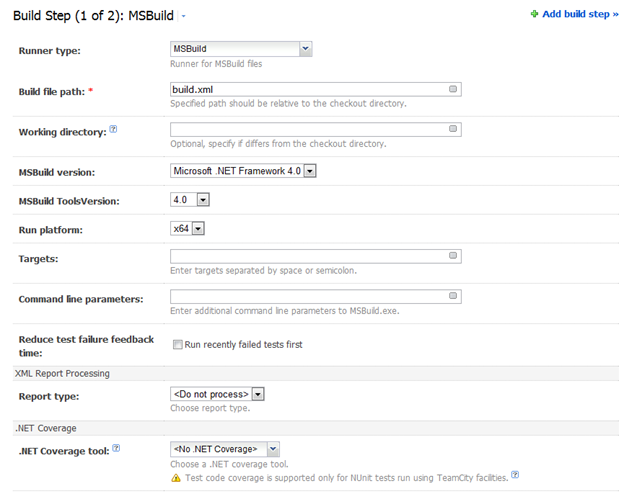
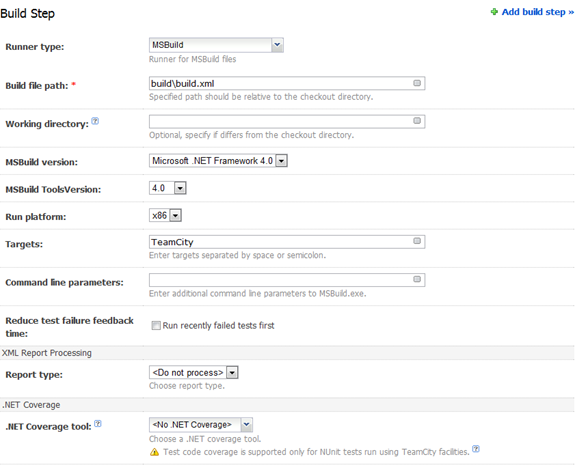
In TeamCity, we create a new build project and setup the VCS root. We then add a new Build Step which calls this MSBuild file:
Notice that all we are doing here is calling our MSBuild script. No coverage settings yet.
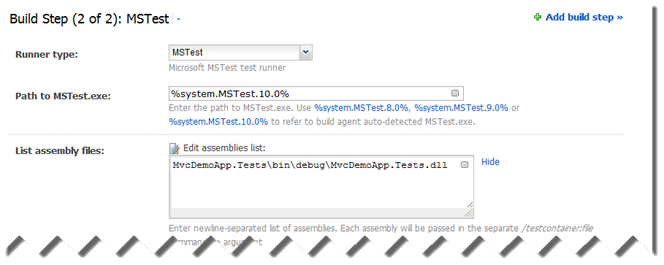
Next thing is to add an additional build step in TeamCity. This time, we are going to call MSTest as opposed to MSBuild:
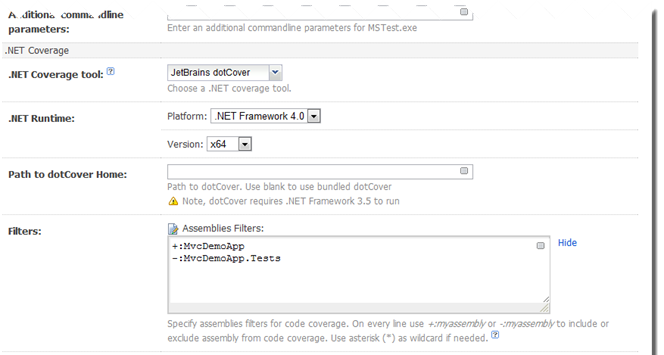
(the sections cut out are blank).
In the .NET Coverage tool section we select JetBrains dotCover and then add the assemblies we want coverage for (just the name of the assembly) prefixing them with +: and filtering out those we do not want coverage for with –:.
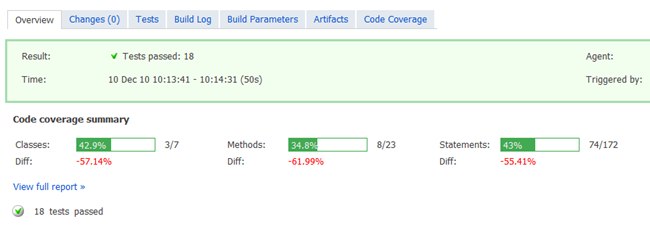
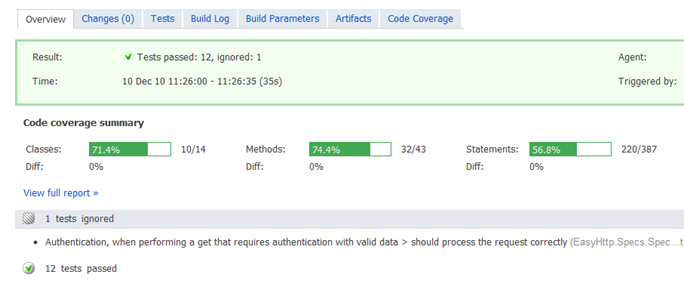
That’s all there is to it. Once we run the Build, we should now see a new tab with Coverage Reports as well as a new Artifact which contains the Coverage files zipped up.
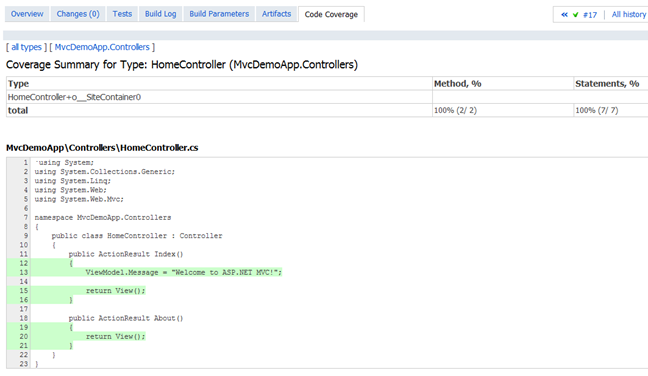
The Code Coverage tab goes into more detail:
We can even drill down into individual classes and examine the code coverage:
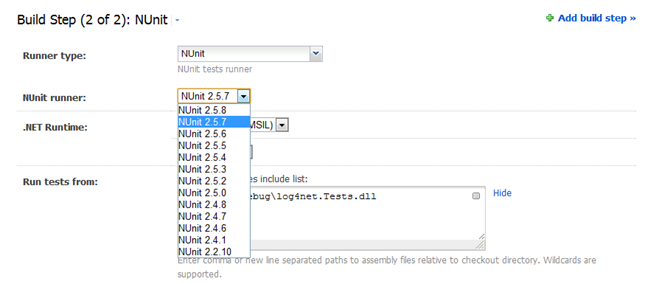
If we are using NUnit instead of MSTest, the only difference is there test runner we select when adding a new Build Step in TeamCity. Instead of MSTest we choose NUnit along with the version:
What about MSpec or my Specific Test Runner?
If we are using MSpec or a different test runner that is not supported directly by TeamCity, we can still get coverage reports; we just need to do a little bit of additional configuration. TeamCity has an API which allows us to send it messages when we want to interact with it (this is actually quite a powerful feature but out of scope for this post so please leave a comment if you’d like me to cover it in more detail). We can leverage this API to tell it when to start coverage and where to get the results from.
Here is the build script for MSpec:
We have created two targets. The second one (TeamCity) is the one we are interested in. This does a couple of things:
-
The first <Exec> runs all MSpec tests so that we can see the test results inside TeamCity. This is not strictly necessary for Code Coverage but usually build processes do display these results. The –teamcity option we are passing in to MSpec is for it to generate the system messages that are then fed to TeamCity (see point 3)
-
The second <Exec> is the one that runs dotCover. This uses a configuration file called dotCover.xml which we will examine further down. We pass in the c (or coverage) option when calling dotCover.
-
This is a message we send to TeamCity to tell it that we have run coverage. We indicate the tool we are using (dotcover in this case) and where the results are located. TeamCity uses this information to then display the results in the UI. This is one of the API messages mentioned earlier.
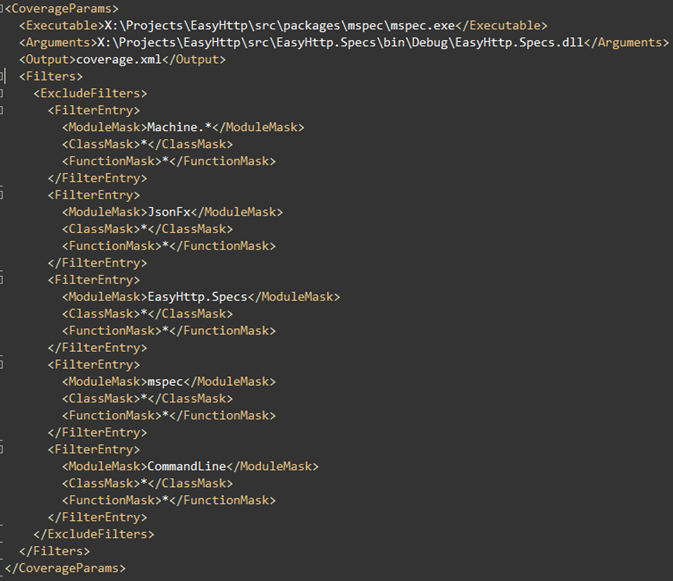
Finally we need to define the dotcover.xml file with out configuration for running dotCover (for detailed information on creating dotCover configuration files, see here and here):
In terms of TeamCity, we then just define our build step that calls out to the build script:
Notice how we do not specify .NET Coverage options explicitly. And if all goes well, we can see the coverage output just as before:
Summary
We can see that running code coverage is now pretty straightforward when using MSTest, NUnit or even a custom test runner. Most of what we have covered for MSpec will work with pretty much any test runner in terms of coverage (feel free to vote here for MSpec support).
With any build process, there are numerous ways of doing the same thing. I’m going to show you one of them. Based on your setup and needs you might want to do things differently. Fortunately TeamCity is flexible enough to allow for many scenarios.
One thing to be aware of is that dotCover creates some temporary files for the XmlSerailizer in the Temp profile folder. This normally is not a problem unless the folder does not exist. If you are running TeamCity under the SYSTEM account, make sure that the folder C:\Windows\system32\config\systemprofile\AppData\Local<strong>Temp </strong>exists. This will probably change in future versions so to avoid any possible issues.
Enjoy!

