I’m starting a new series of blogs posts on profiling, where we’ll try and cover common bottlenecks and how to identify them in your applications. However, before delving deeper into the subject, let me make a small but important observation:
Your bottleneck is probably not your for loop
Now, replace that for loop with switch statement, an older version of some outdated algorithm that you feel needs optimizing, or that retched collection of classes that would perform better if you were using an array to loop through them, and you’ll end up with the same observation.
Premature Optimization
When dealing with business applications, it is unusual for major performance problems to be pinpointed down to specific portions of code or a concrete implementation of an algorithm. Usually most of the issues are bottlenecks at the data level, network level or purely down to how a business decision is made.
Whether we use an ORM or use SQL directly, incorrectly formulated queries are one of the most predominant causes of bad performance. Not understanding concepts such as Lazy or Eager loading when using an ORM can be disastrous to the performance of an application, and are usually portrayed as “ORM XYZ sucks at performance”.
Network bandwidth and latency are other issues; when dealing with web applications for instance, having large pages (i.e. ViewState) or rendering Javascript directly without using script files, are a common problem for performance penalties. Making heavy calls to the server when very little information is required (i.e. UpdatePanel used incorrectly) are again main causes for concern.
In many cases, design decisions we make early can affect the performance of our applications, and it is important to identify these concerns and address them correctly. Using an ORM, profiling it, understanding how Ajax really works and not worrying about working with Javascript, or using an asynchronous architecture when dealing with long running business processes are many ways to avoid bad performance in the long run.
On the other hand, what we shouldn’t do is focus on micro-optimizations, on trying to make the most efficient, yet completely undecipherable algorithm to calculate the probability of winning money when buying lottery tickets, when the underlying problem is a bottleneck caused by a bad query. This kind of approach is often referred to as Premature Optimization, and can be disastrous for a project.
When it does boil down to code
Having said all that, there are times when we need better performance after having eliminated all the obvious causes, and need to discover why something is not performing as well as it should be. Of course, these concerns are greater when the nature of our application demands highly optimized code. In these cases, it is crucial to understand how things work in order to solve the problem. As a old-school boy, before we had managed libraries and drag-n-drop, I’m also a firm believer that it is always important to understand how things work under the covers, even if it is to just improve one self's knowledge.
Therefore, in these series of blog posts about performance, I’m going to focus on the latter, examining the details of code and how some things can perform better than others. So given the disclaimer, let’s get down to business.
In order to do performance tuning, you need to use a tool. Setting stopwatches doesn’t work, because as Christian Gross so rightly pointed out during one of his talks, and I semi-quote: ‘if you’re using a stopwatch, you think you know where the bottleneck is. Most of the time, you’re wrong’. If you are setting using a manual approach of setting calling Start and Stop, trying to time something, you’re assuming you know that the performance problem is located in a particular point, and many times it is not that point. So you end up having to place these kind of diagnostic codes in various places in your code, and soon it becomes a maintenance nightmare. Fortunately, there are tools that can profile your application in a non-invasive manner. When talking about SQL profiling, there’s NHProfiler for instance. When it comes to code performance profiling, the two most known ones are ANT Profiler and dotTrace. I’m going to be using dotTrace. I used it before joining JetBrains and continue to use it now that I’m at JetBrains. I’ll be using version 4.0 which is currently (at the time of writing this post), in Early Access Program and with Beta being released very soon.
To Express or not Express
Those that are familiar with it ASP.NET MVC know it relies heavily on the use of strings in many areas. For instance, when defining ActionLinks, you write
Html.ActionLink(“Home”, “Index”, “Home”)
where the first parameter is the link text, the second the Action and the third parameter is the Controller. The problem with this of course is that if you type either the second or third parameter incorrectly, you won’t know until runtime. Even if you build your views it won’t help.
An alternative is to use Expression based Html Helpers (another option is to use ReSharper of course :)). These are strongly-typed ActionLinks that do not ship out of the box with ASP.NET MVC, but are available as a separate download in the MVC Futures assembly, which can be thought of as a kind of sandbox for Microsoft to play with. Some of the functionalities in this library have eventually made it to the main core, such as RenderPartial, which was in fact there from pretty much the early Previews of MVC 1, and didn’t get all the excitement until it made it into the core in version 2. Other functionality, including the expression based ActionLinks haven’t made it in yet. When using these helpers, the previous link would be:
Html.ActionLink<HomeController>( a => a.Index, “Home”)
In principle this looks good, and begs the question of why it is not in the main core. Well I don’t know the exact reason, but one could potentially be due to it’s performance. Several people have talked about the difference in terms of rendering when using this version as opposed to the standard string based one. You can find one of those posts here. What I thought I’d do, is actually see how much difference in speed there is between one and the other.
The Project
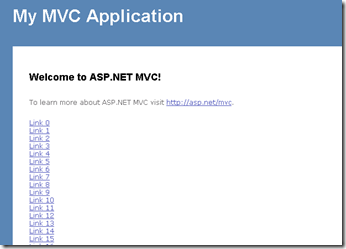
I’m using a very simple project for this profiling. It’s your standard ASP.NET MVC 2 application. On Index page, I’ve added two blocks of code:
- <% for (int i = 0; i < 1000; i++)
- {%>
- <%= Html.ActionLink("Link " + i, "Index", "Home")%><br />
- <%
- } %>
- <% for (int i = 0; i < 1000; i++)
- {%>
- <%= Html.ActionLink<HomeController>(a => a.Index(), "Link " + i)%><br />
- <%
- } %> </ol></div></div></div>
- Sampling: dotTrace will do frequent analysis of calls stacks. It’s the least intrusive, has very little impact on performance, but gives approximate timing.
- Tracing: dotTrace receives notifications from the CLR on entry/exit of methods. More precise timing and call information.
- Line-by-Line: dotTrace logs times for every statement in methods. Most precise but also has higher impact on performance. </ul>
The first for loop will render out 1000 links using the string based ActionLink version, whereas the second loop will do the same using the expression-based one.
What we want to do now is run this and see how long it takes for each loop to complete.
Setting up dotTrace Profiler
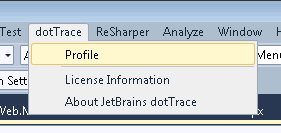
Working with dotTrace is as easy as it gets. There are two ways to profile an application: Standalone or integrated within Visual Studio. In the case of the former, you can start up dotTrace outside of Visual Studio and point to an application to profile. On the other hand if you have it integrated inside Visual Studio, then all you need to do is click on the Profile menu option:
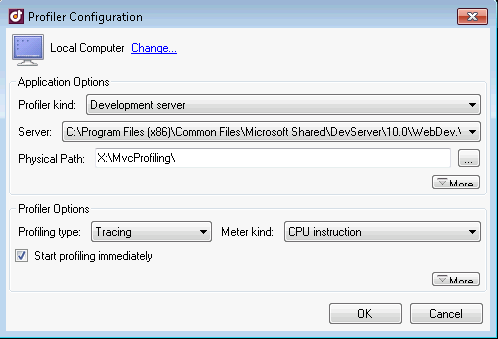
Once we do that, we get a dialog box that provides us a series of options, mainly to do with the type of profiling we are going to perform.
 </a>
</a>
Since we’re profiling a web application, we can either use the Development Server or Internet Information Server. In our case we’re going to use the former. dotTrace will automatically pick up the server settings as well as fill out the physical path for our application.
Next come the profiling options. The basic settings are Profiling Type and Meter Kind. The first parameter indicates how profiling will take place. It can be:
Tracing is normally the recommended option. Meter Kind defines how dotTrace logs the time: CPU instruction or Performance counter (uses the Windows API and samples are hardware independent).
Profiling our application
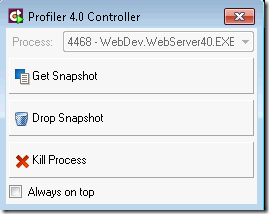
Once we have everything setup, we can start profiling our app. dotTrace will launch a small panel that allows us to control data sampling.
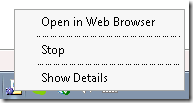
dotTrace does not by default however launch the browser. In order to do so, we need to either click on the WebDev server and Open in Browser or just type the URL directly in the browser.
The next step is to perform the operations we want to profile and then click on GetSnapshot.
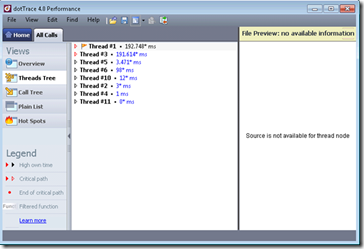
Since in our case, having rendered the Index action performs these operations, once the page has been loaded, we can click on GetSnapshot and have the profiler launched.
I’m not going to get into all of the details of dotTrace in this first post because otherwise it would never end; we’ll cover some of the aspects in future posts. For now, lets focus on our performance test at hand which is the difference between the two types of ActionLinks (string and expression based).
The easiest way to find what we are looking for is to use the…you guessed it, Find feature. Ctrl+F will bring up a dialog box similar to ReSharper’s Type location. We can then type ActionLink to filter the list of functions down to the ones that interest us
We can see that there are two versions, as expected. Let’s drill in to the second one first, the string based one. Hitting Enter will find the first location. We can then press F3 until we find the one that interests us. Remember, Site.Master and other references to this call also exist. We’re specifically looking for the loop, the one with 1000 calls
We can see that the ActionLink call takes 121ms for 1000 calls. Drilling in, we can see exactly where the time is spent, and 104ms of that is calling GenerateUrl. Now let’s take a look at the Expression based ActionLink
For the same 1000 calls it takes 140ms, which is an increase of approximately 17%. Diving in once again, we can see that 6ms of this is in the parsing of the expression tree, GetRouteValuesFromExpression. What this function does is merely analyze the expression to extract the ActionName from the parameter. The ControllerName it already has since it’s the concrete type the generic method is invoked with, returning both values in a RouteValueDictionary. As such it then needs to call GenerateRouteLink as opposed to GenerateLink since the former takes a RouteValueDictionary as a parameter, whereas the latter takes strings indicating the controller and action. They ultimately both call GenerateUrl.
Summary
From the results, the difference between the two calls is not that
significant for 1000 links. As the number of links increment, the
difference between the two does not change significantly. For instance,
rendering 10.000 links, has a difference of 50ms between one version
and another.What’s interesting that having run the same profiling on previous
releases, the difference in time was nearly double, so there seems to
have been improvement in this area. And as we can see, sometimes what might seem a performance problem, isn't necessarily one.
